Educational overview
Picture graphs turn familiar counts into visual data. Learning to read a key and compare categories prepares children for bar graphs and data questions.

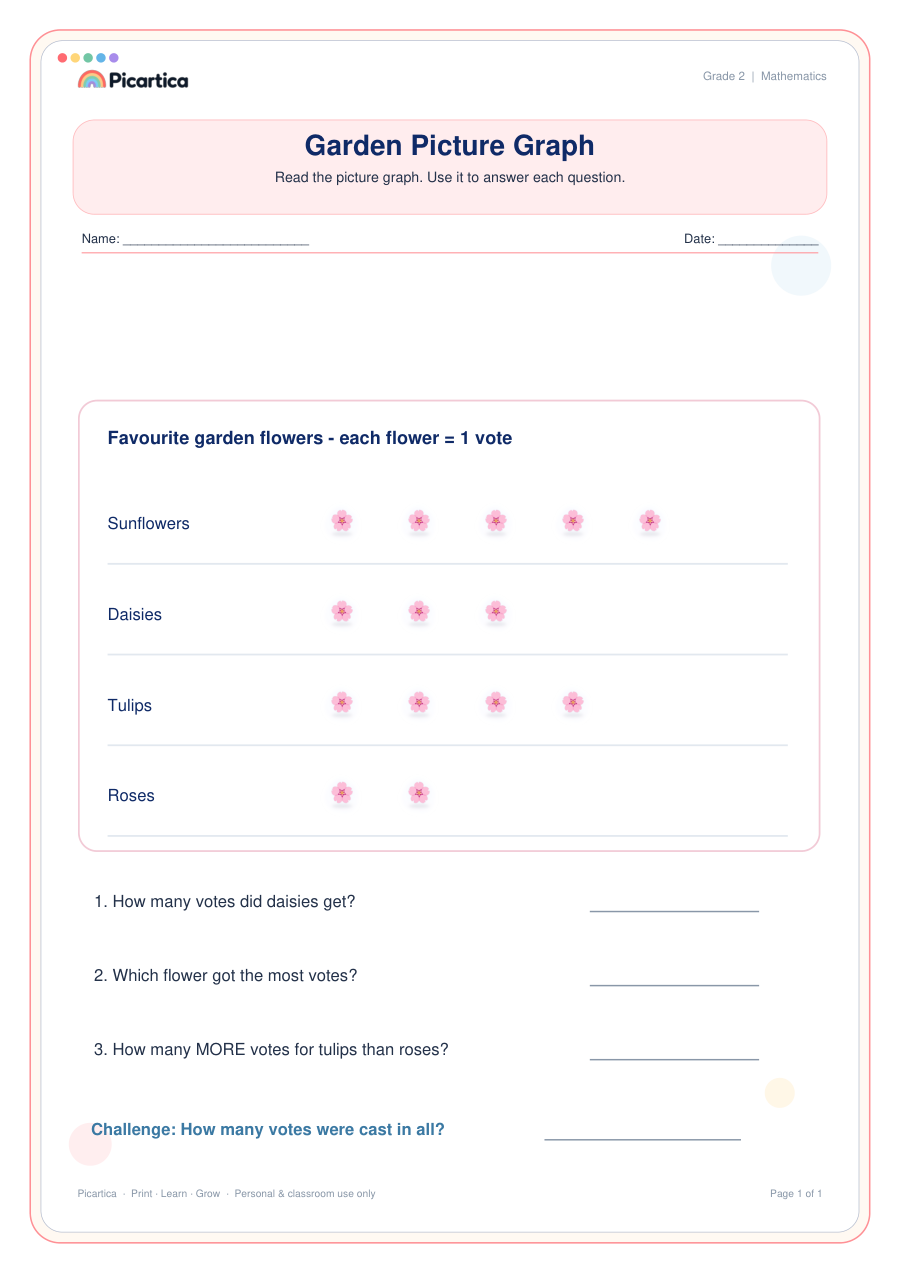
Read a garden-votes picture graph where each flower symbol represents one vote, then answer questions about totals and differences.
Free for personal, homeschool and classroom practice according to Picartica’s usage terms.
Picture graphs turn familiar counts into visual data. Learning to read a key and compare categories prepares children for bar graphs and data questions.
Build confidence in picture graphs by practising read a one-symbol-one-vote picture graph and compare categories using more and fewer.
Read the graph key first. Have the child count each row's symbols, then point to the evidence before writing an answer.
Survey four family members about a favourite fruit and make a new picture graph.
Use the subject and difficulty collections to choose the next appropriate practice.